Understanding Classification Metrics in Data Science
Classification is one of the most common applications of data science, for example predicting whether an email is spam.
There are metrics that can be quite useful to understand the performance of data science classification algorithms/models: accuracy, precision and recall. If you are interested in data science or AI, you have probably already come across these terms. This article may help clarify them.
These metrics can sometimes be confusing, so I thought I would share some elements and examples I felt were insightful.
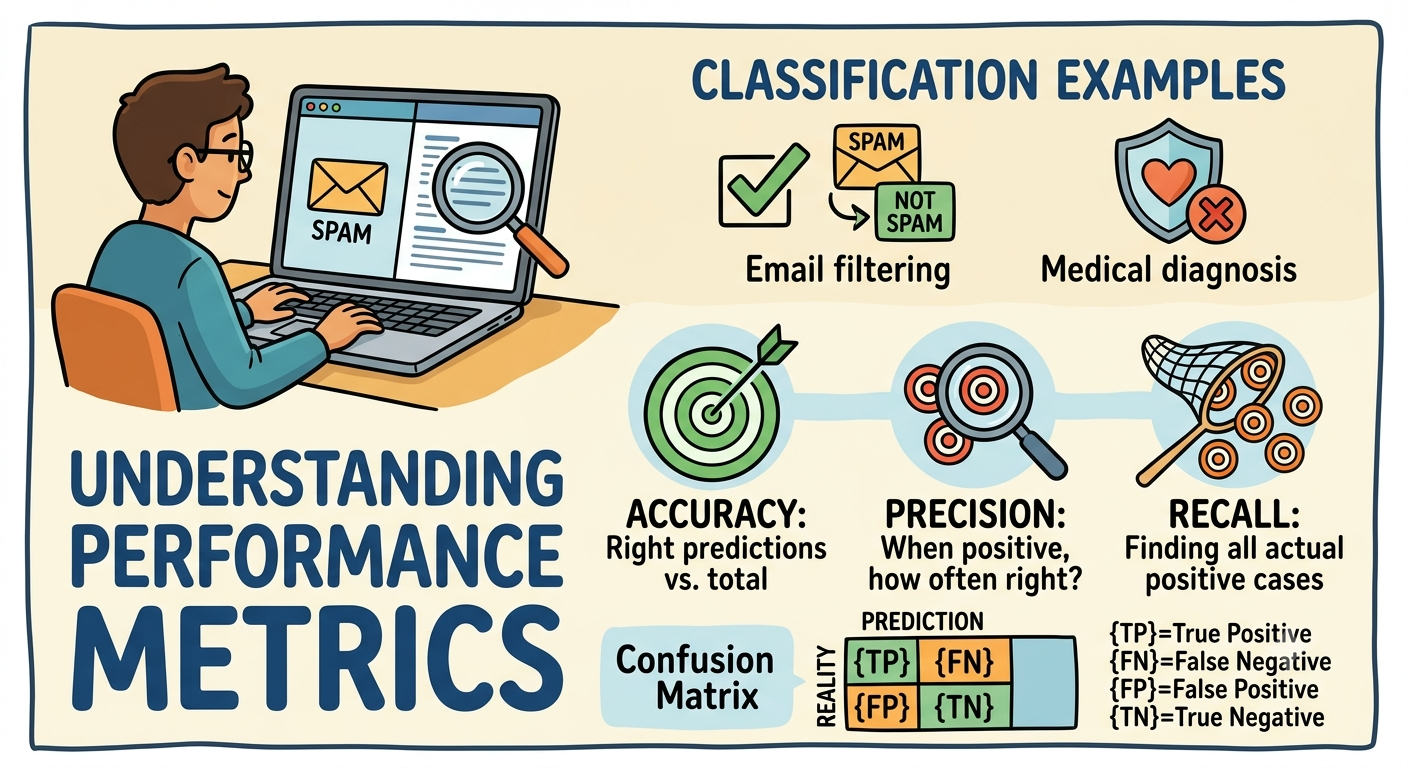
Confusion matrix
One basic representation of classification results is the confusion matrix.
| ↓ Reality / Prediction → | Positive | Negative |
|---|---|---|
| True | {TP} | {FN} |
| False | {FP} | {TN} |
It summarizes the number of:
- {TP} (True Positive) - Number of true (correct) positive predictions (e.g. a spam that is really a spam)
- {TN} (True Negative) - Number of true (correct) negative predictions (e.g. a message not flagged as spam, appropriately)
- {FP} (False Positive) - Number of false (incorrect) positive predictions (e.g. a spam that is not really a spam)
- {FN} (False Negative) - Number of false (incorrect) negative predictions (e.g. a message not flagged as spam whereas it should have been)
These four values are used to compute the metrics, but let’s get concrete with an example.
Example: Allergy detection bot at the canteen
Imagine a canteen (at school or company) where there is a bot you can ask to check the food you pick to make sure it won’t trigger your allergy based on its ingredients.
The bot can be configured in two different modes, leading to different behaviours and user experiences.
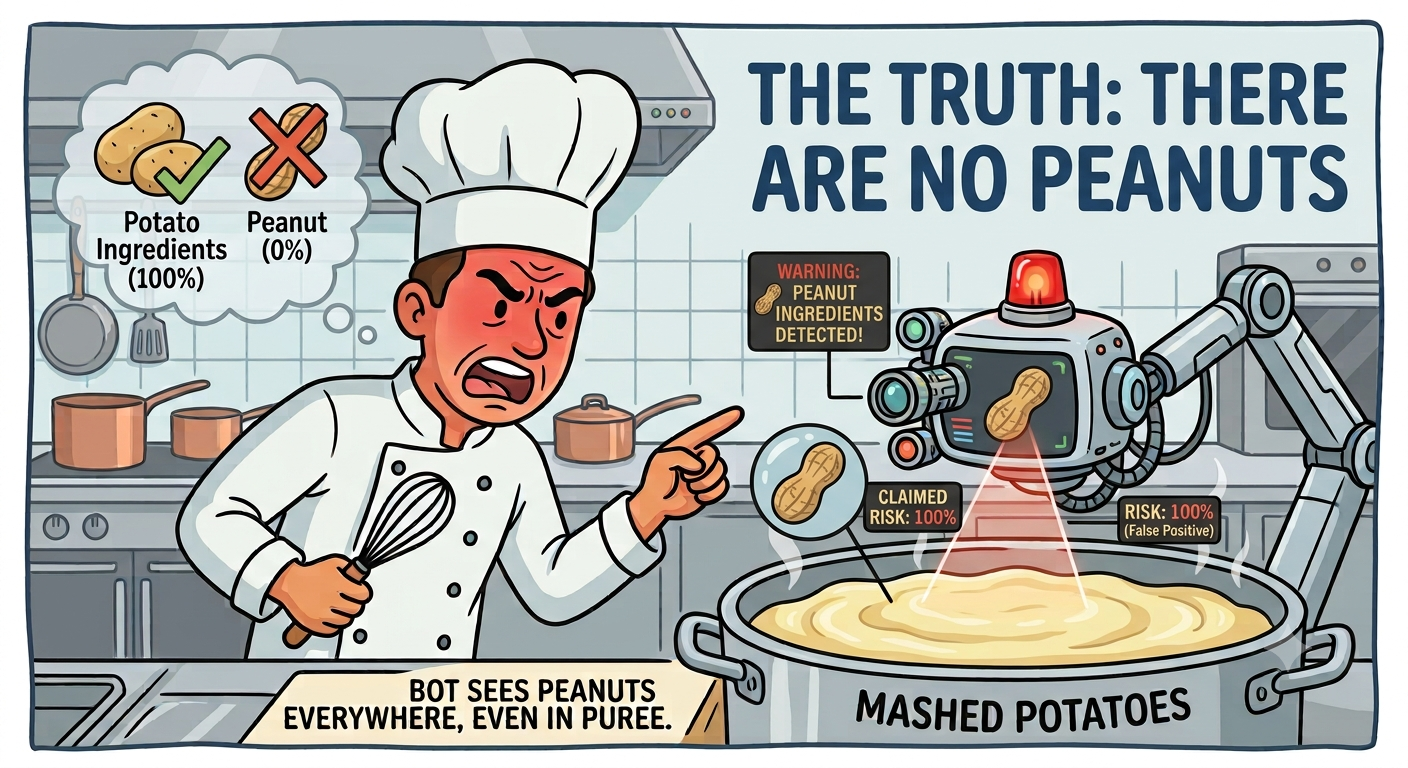
😨 Paranoid
At the slightest doubt, the bot raises an alert: prevention is better than cure.
- Most risky foods are correctly detected (True Positive).
- Very few risky foods are incorrectly considered safe (False Negative), which means dangerous cases rarely go unnoticed.
- However, some safe foods are incorrectly flagged as risky (False Positive).
- Consequently, the chef hates the bot, which sees 🥜 everywhere — even in mashed potatoes.
🧘 Zen
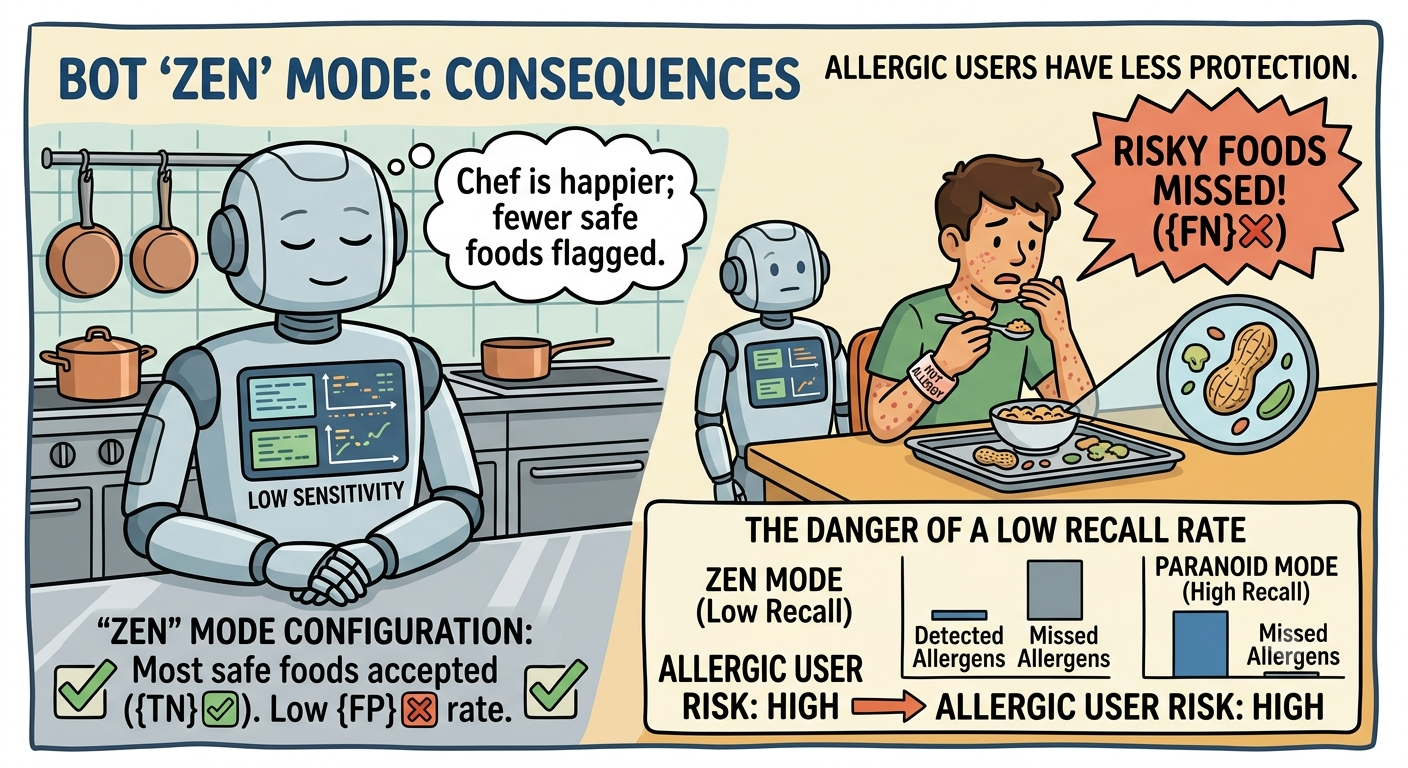
The bot tries to avoid unnecessary warnings and prefers not to cry wolf.
- Most safe foods are correctly accepted (True Negative).
- Few safe foods are incorrectly flagged as risky (False Positive), avoiding unnecessary warnings.
- However, some risky foods are missed (False Negative).
- The chef is happier, but allergic users have less protection.
ℹ️ Summary
Let’s apply the confusion matrix to the current example.
| ↓ Reality / What the bot say → | “Risky” | “Safe” |
|---|---|---|
| Allergy risk | {TP} ✅ Allergy properly detected | {FN} ❌ Allergy missed |
| No allergy risk | {FP} ❌ Useless alert | {TN} ✅ Safe food properly accepted |
The confusion matrix does more than count correct and incorrect predictions: it distinguishes the different kinds of errors, which is exactly what the following metrics are built upon.
Metrics
Now that the different types of classification results are clear (I hope), we can look at the metrics derived from them.
First, accuracy is simply the ratio of correct (true) predictions, considering the total number of predictions.
The precision focuses on positive predictions. For the example, it answers the question “When the bot raises an alert, how often is it actually right?”.
Recall, on the other hand, focuses on actual positive cases. It answers the question “Among all risky foods, how many did the bot successfully detect?”.
Back to the example of the canteen bot above, the paranoid mode is characterized by a high recall, in order to maximize people’s safety, even if it compromises the precision. On the contrary, the zen mode is focused on precision: alerts should be reliable and false alarms should be minimized.
You may wonder then why not just consider the accuracy alone. For the canteen bot example, if it’s used 10,000 times, with only 10 meals that can really trigger an allergic reaction, and so 9,990 that are safe. Using the zen mode, the bot raises an alert only when it is almost certain there is an allergy risk. In this scenario, it never raises an alert, so 0 of the 10 risky foods are detected. The resulting accuracy will be almost perfect: 99.9% ((0 + 9990) / 10000). It looks good, but is not protecting the people at all.
ℹ️ Summary
Depending on the cost of errors, classification models should not be evaluated using accuracy alone. Precision and recall provide additional insights by distinguishing between false alarms and missed detections, helping choose the model—and even its decision threshold—that best fits the real-world objective.
| Metric | Formula |
|---|---|
| Accuracy | (TP + TN) / total |
| Precision | TP / (TP + FP) |
| Recall | TP / (all positive cases: TP + FN) |